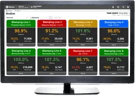


What Is XL?
A Production Monitoring System Built for You
Any machine. Any process. Anywhere.
See what’s actually happening in your production - and fix what’s holding you back.
Trust us. We’ve done it 42,000+ times.

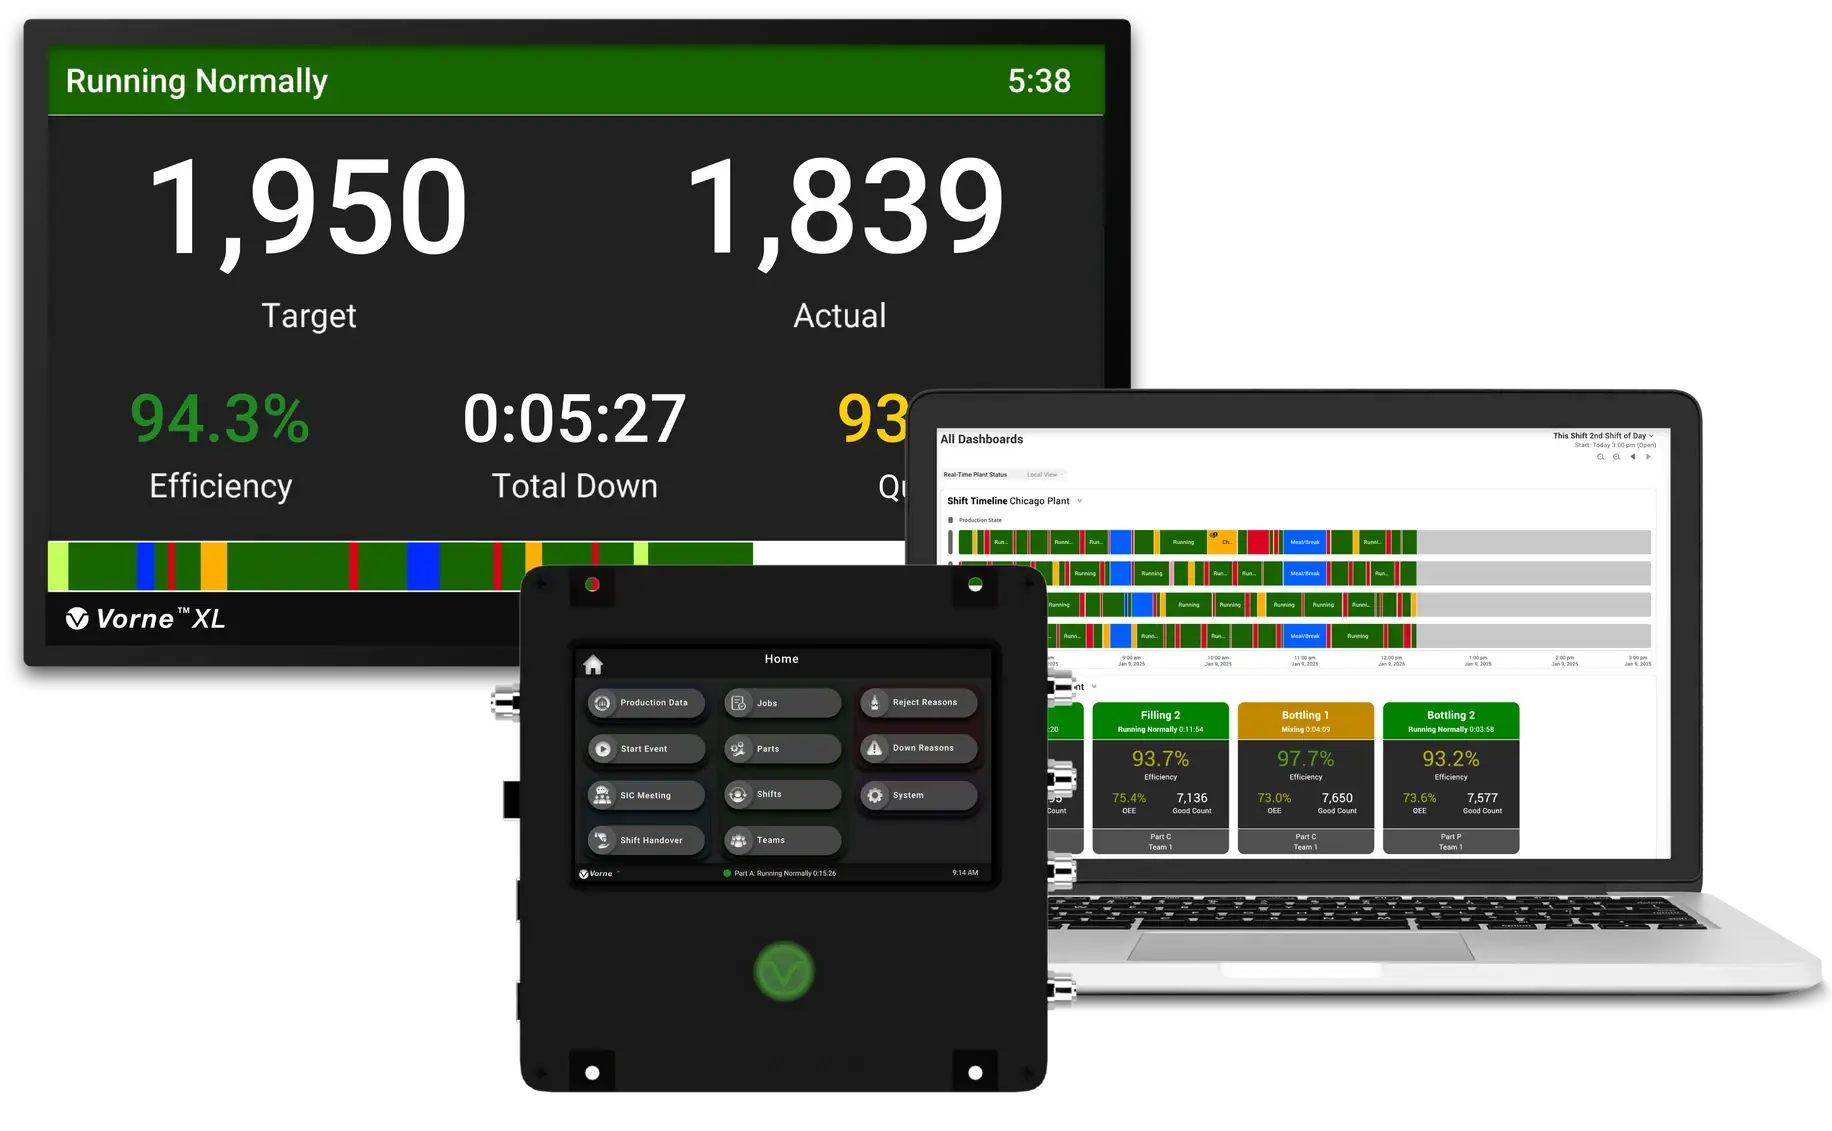

The XL device is the foundation of the platform. It connects directly to your machines and turns raw data into actionable production insights in real time.
- Connect power and 1–2 signals (sensor, PLC, or relay)
- Capture run, stop, and count data automatically
- Works with your existing equipment
- No servers, no complex infrastructure
It’s designed to be simple to install and easy to integrate with your existing equipment.
Each XL device handles data collection, processing, and plant-floor visibility - all in one system. Once connected, XL automatically captures and processes production data powering dashboards, reports, and plant-floor displays without additional systems.
What's Included and What You'll Need
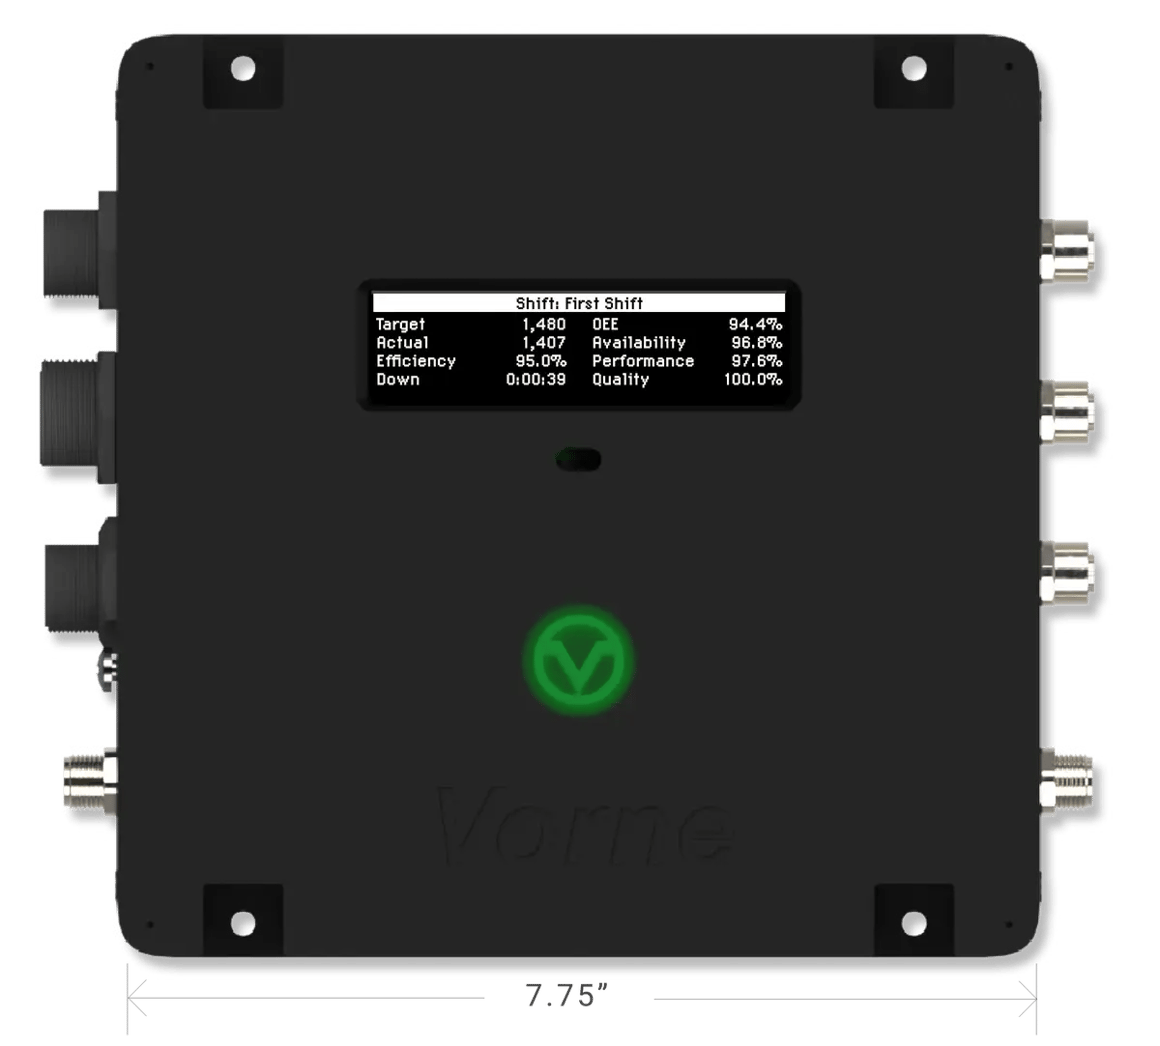
Everything needed to collect, store, and visualize production data is built into XL. You just connect it to your machines and your network.
Most teams get started with:
- 1 XL device
- 1–2 signals (sensor, PLC, or relay)
- 1 network connection
| What’s Included in XL | What You’ll Need |
|---|---|
| XL Productivity Appliance | One or Two Sensors |
| Power Cord | Ethernet Cable |
| XL Barcode Kit (Optional) | TV or Flat Panel (Optional) |
Most popular starting point: XL HD+ $4,690 one-time cost
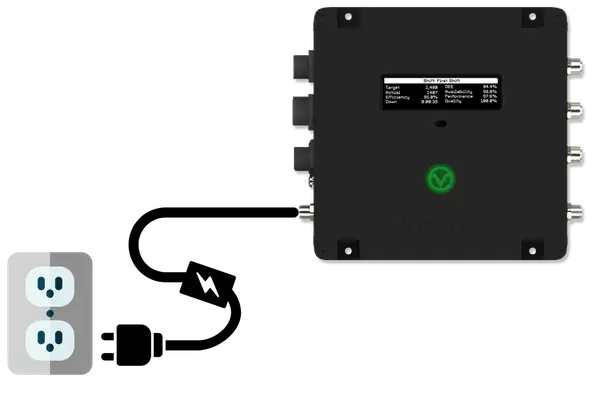
1. Power On
Connect XL to power and get started.
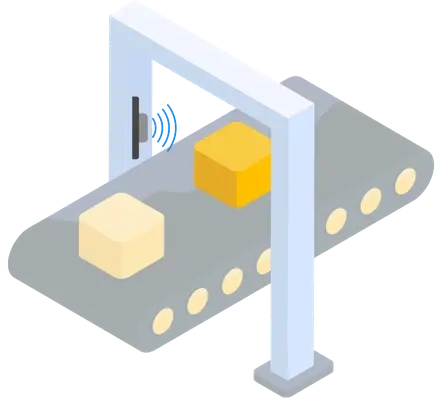
2. Capture Machine Data
Connect one or two sensors - a photo-eye, relay, or proximity switch - or your PLC to begin collecting real-time production data.
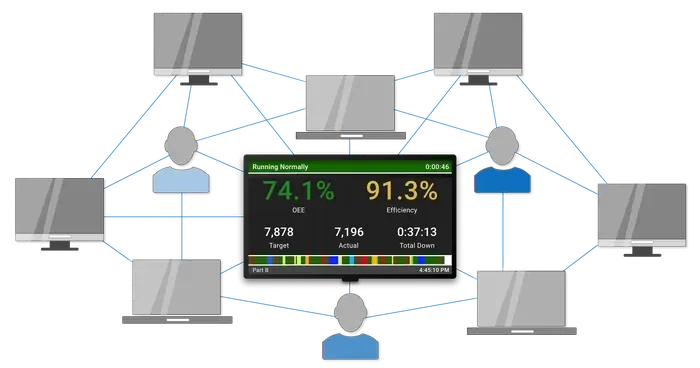
3. View Performance
Connect XL to your network and access dashboards, reports, and plant floor displays from any computer, tablet, or phone.
How to Use the XL Platform
The XL platform gives your team the tools to monitor production, understand results, and act on what matters most.
In Real Time
- Track downtime, efficiency, cycle time, and output
- Compare target vs actual by line, shift, product, or job
Across Time
- Analyze downtime, losses, and performance trends
- Identify top losses and prioritize improvement efforts
- Review OEE across machines, lines, and plants
Across Your Operation
- Make comparisons by line, area, part, or shift
- Access dashboards from any device - computer, tablet, or phone
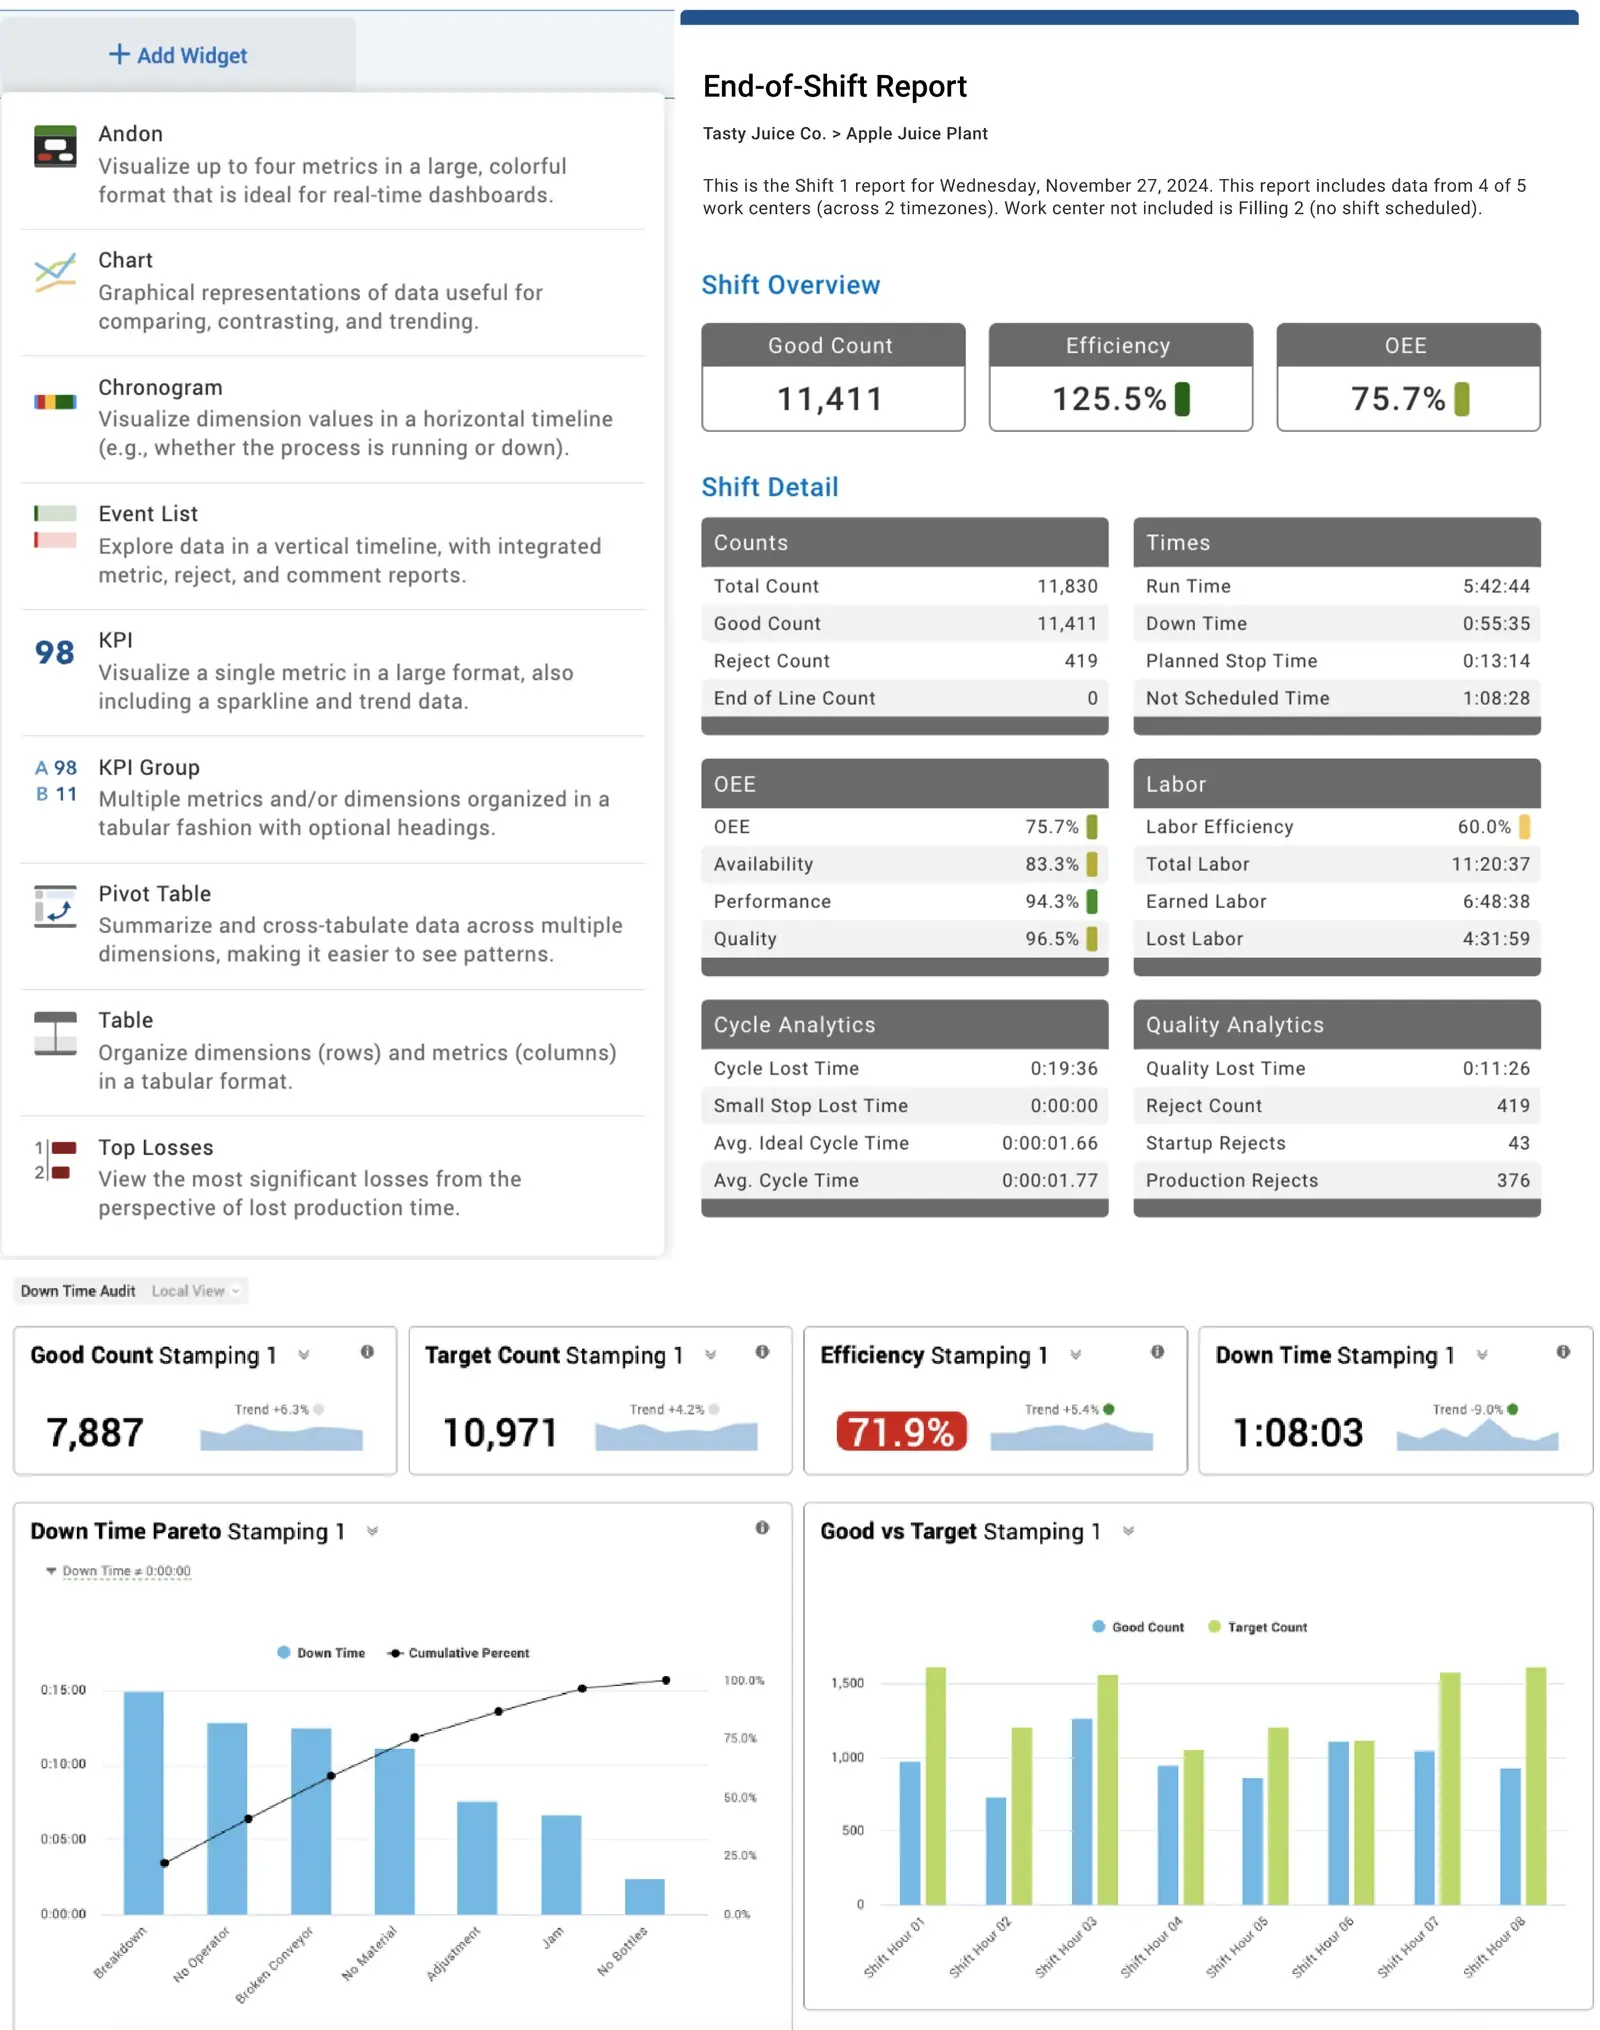
Built-In Reports
Full-featured reporting and analytics including built-in reports and instant export to Microsoft Excel.
- Changeover
- Down Time
- Hidden Factory
- Six Big Losses
- Teams and Labor
- Total Production Timeline
- Many more!
Metrics
Choose from over 140 metrics (available both in real time, as well as for historical analytics).
- OEE
- Cycle Loss
- MTBF and MTTR
- Run Time
- TEEP
- Target Count
- Many more!
Custom Reports
Create custom dashboards by combining any of our pre-built visualizations to craft your perfect production report.
- Andon
- Chart
- Chronogram
- Event List
- KPI
- Top Losses
- Many more!
Accurate Automatic Downtime Tracking
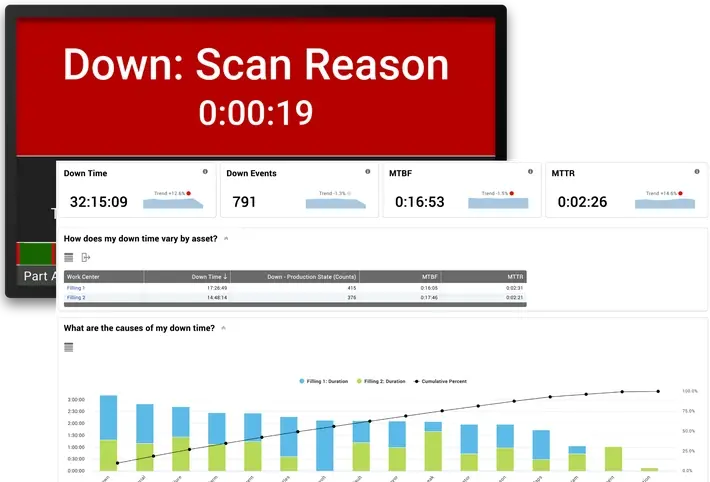
Most companies are shocked to discover their true downtime, and you’re about to see yours. Capture downtime reasons where they happen, when they happen. Every second, every detail, every time.
Data Anywhere, Data Everywhere
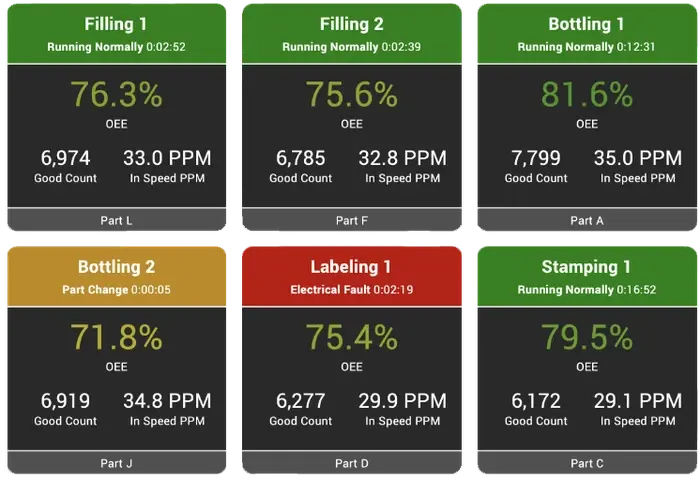
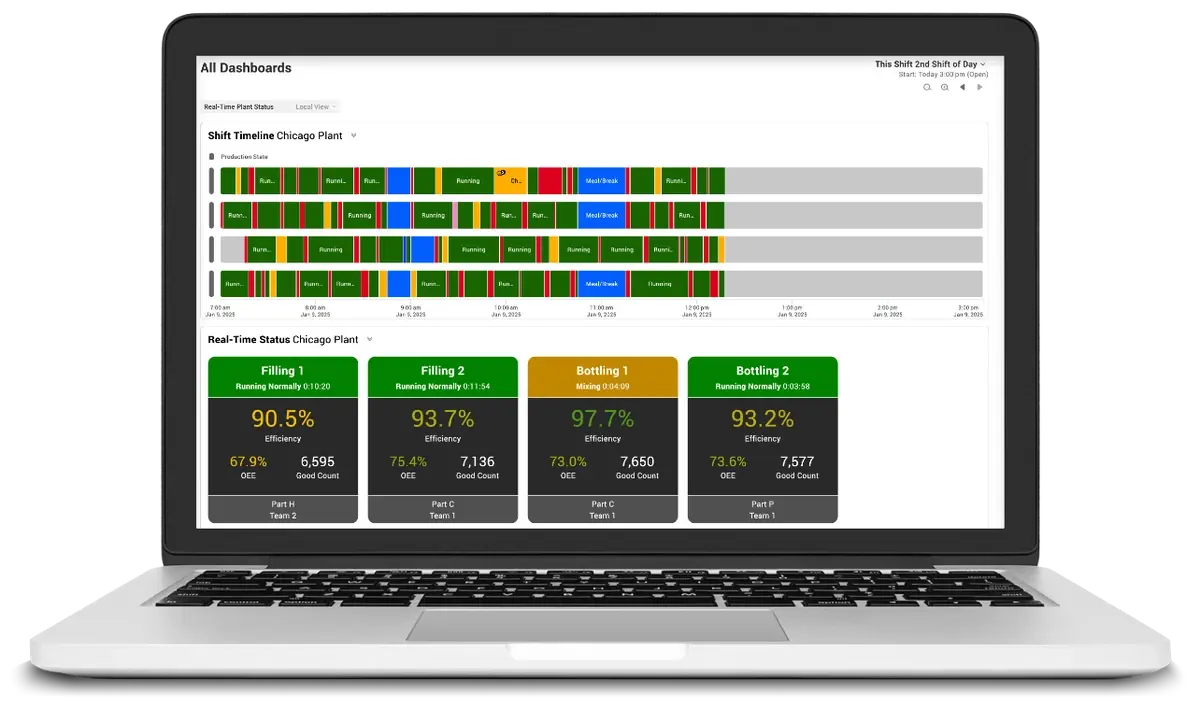
With the Andon report, see real-time data from every monitored line in your plant, even when you aren’t on the plant floor. Instantly know where attention is needed.
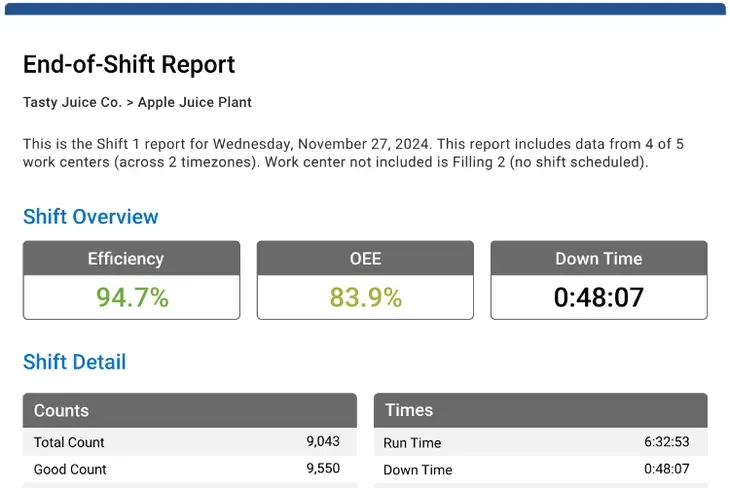
Automated Email Reports & Text Alerts
Instantly receive end-of-shift reports in your inbox and see if your team hit their targets. Receive automatic email and text alerts to see problems that need immediate attention.
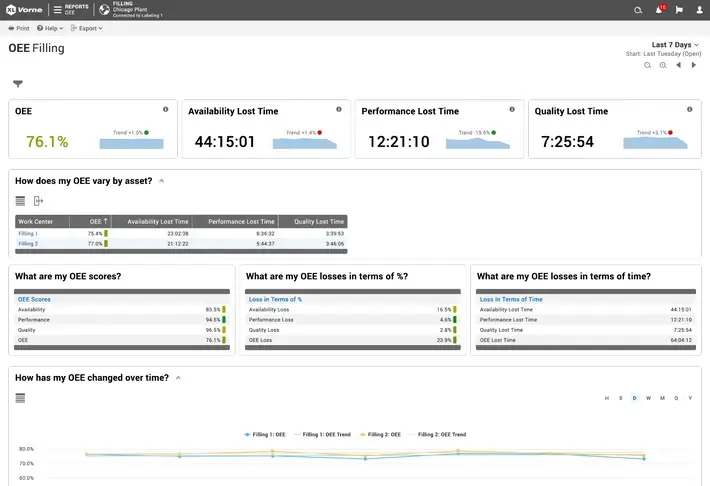
Configurable Reports and Exports
Quickly create dashboards with our nine powerful built-in widgets. Report by anything you can imagine - Shift, Part, Team, Reason, and more. Your data belongs to you. Report in XL, and export to Excel.
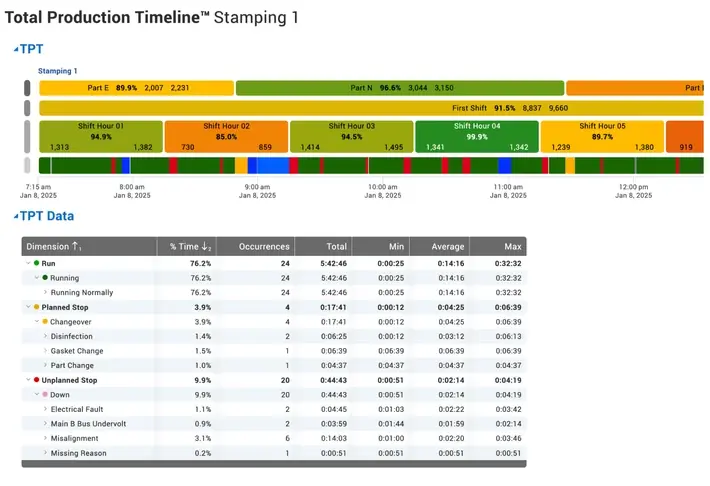
Instant Shift Visibility
See a precise production timeline populate in real time. View when you’re Running and when you’re Down, in Changeover, or in Meal/Break, and why. Identify and break patterns.
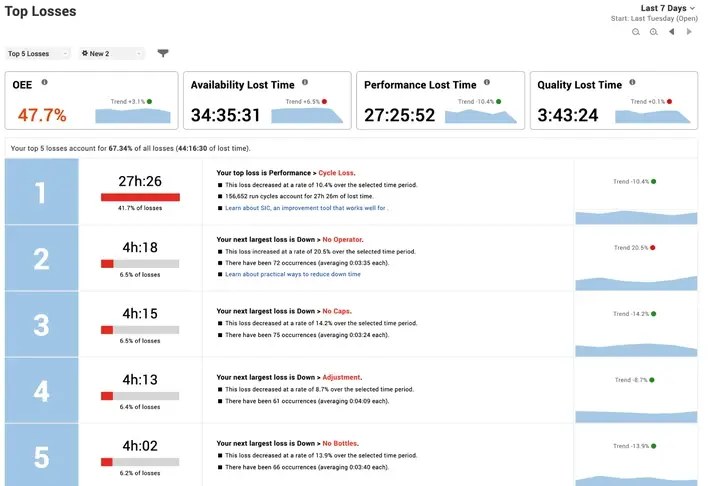
Top Losses
Identify top losses with blinding clarity on what to fix next. Trend indicators and sparklines tell your story in a glance. It’s your built-in Continuous Improvement roadmap.
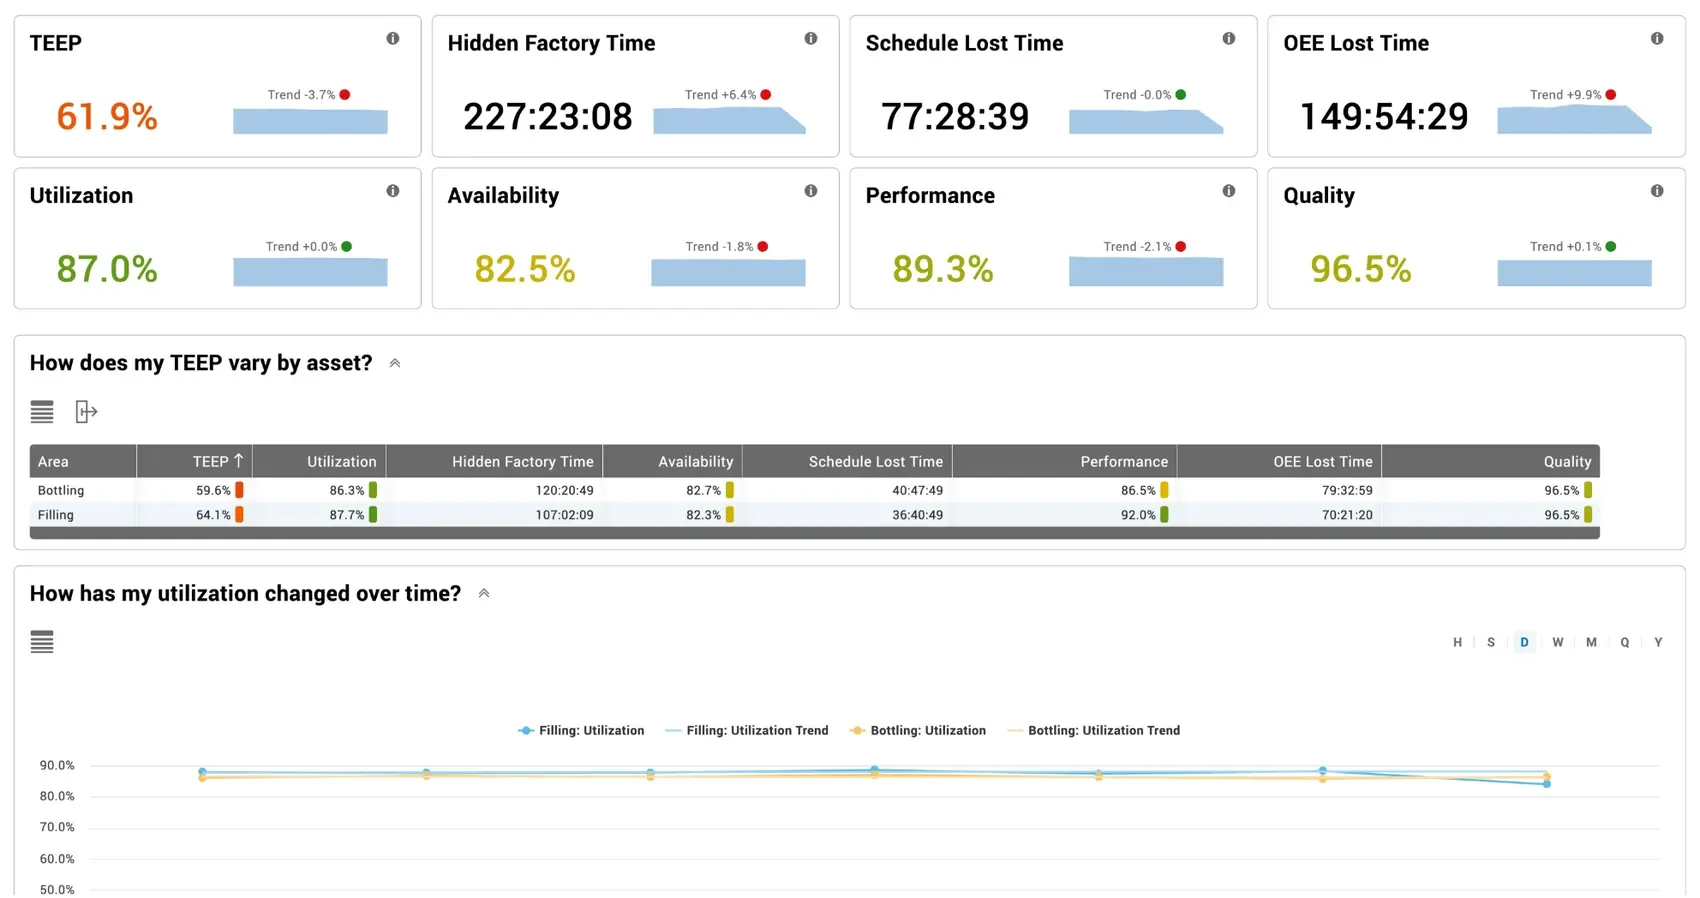
Built-in TEEP report that highlights Utilization and Hidden Factory Time to extend improvement beyond OEE.
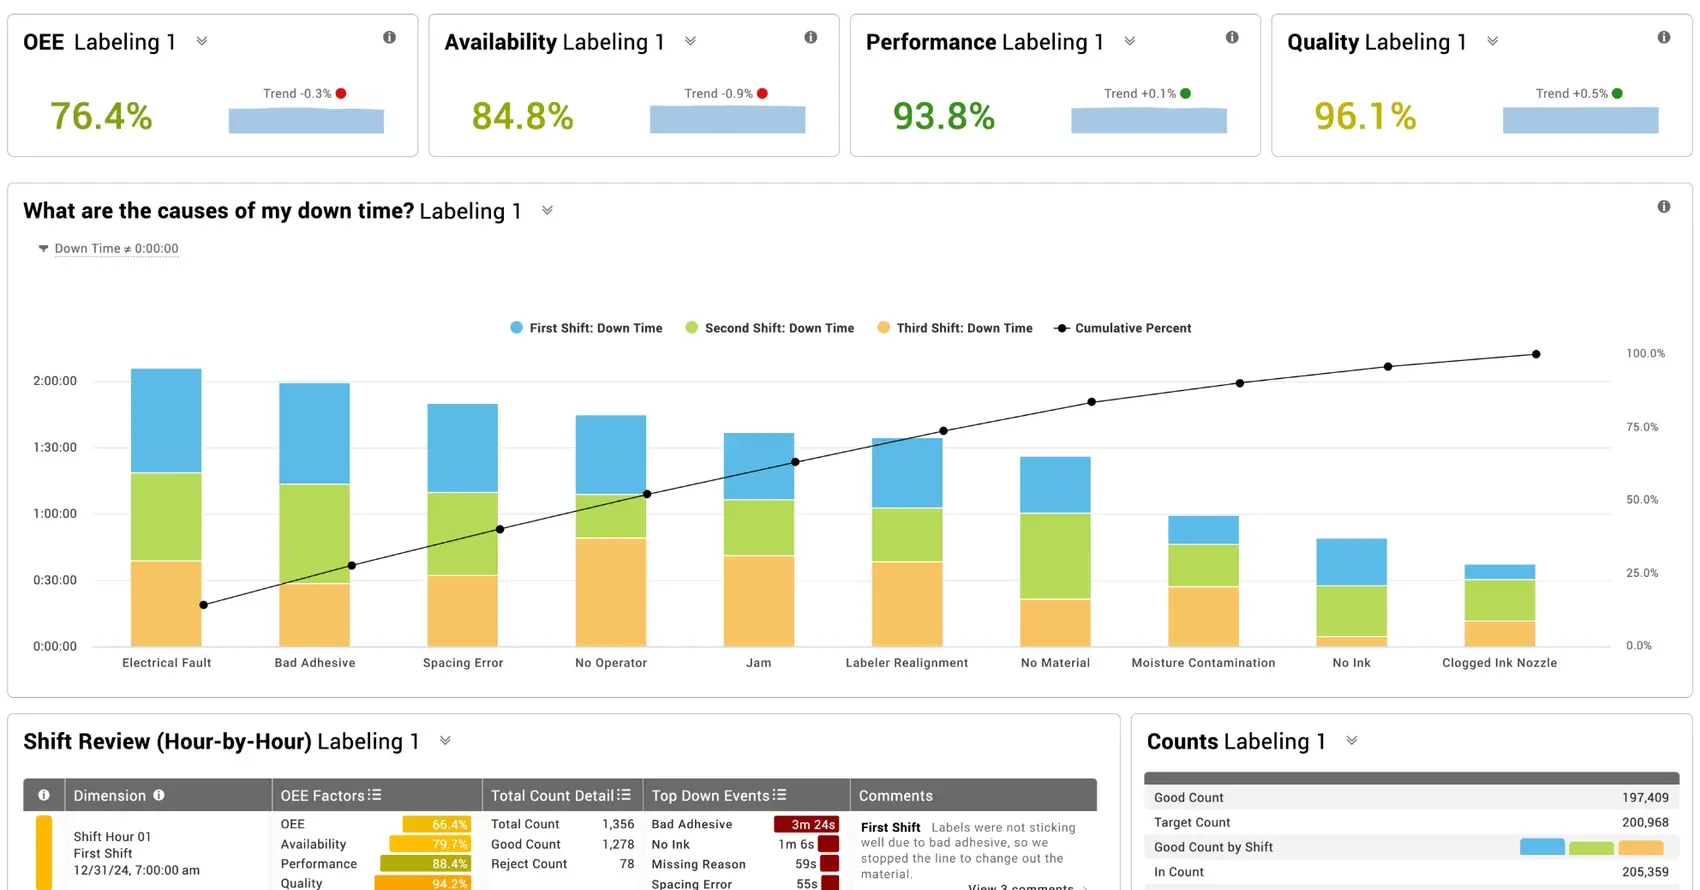
Custom “Daily Shift Report” built in just minutes using the Vorne XL Dashboard interface.
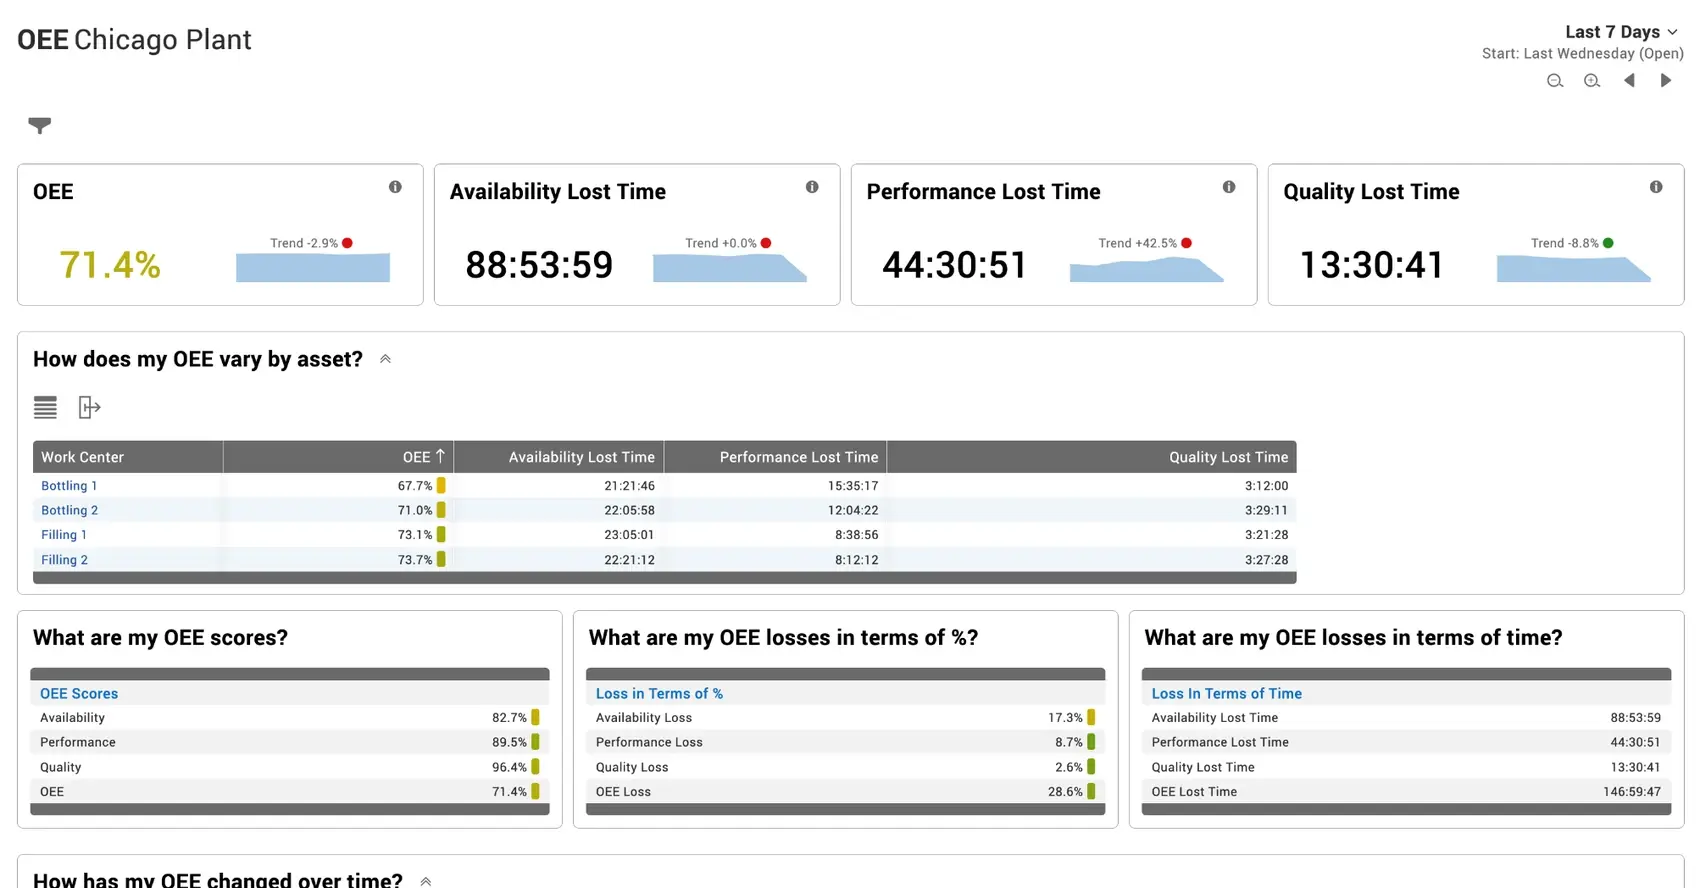
Built-in OEE dashboard configured to show OEE and its underlying factors for an entire plant over the past week.
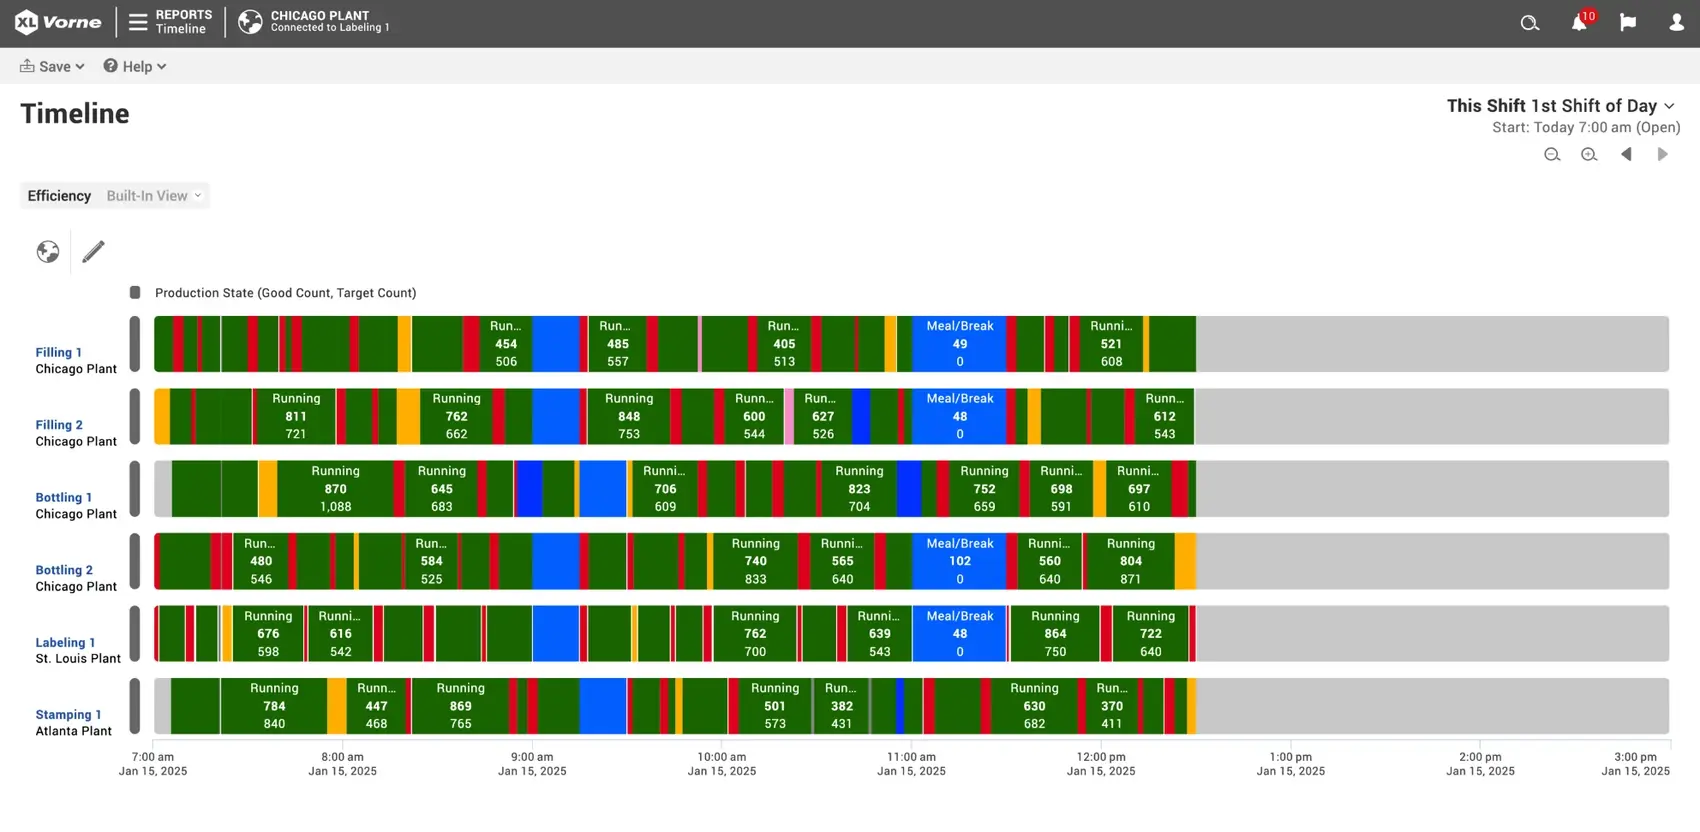
Built-in Timeline report depicting Production State, Good Count, and Target Count for an entire Plant.
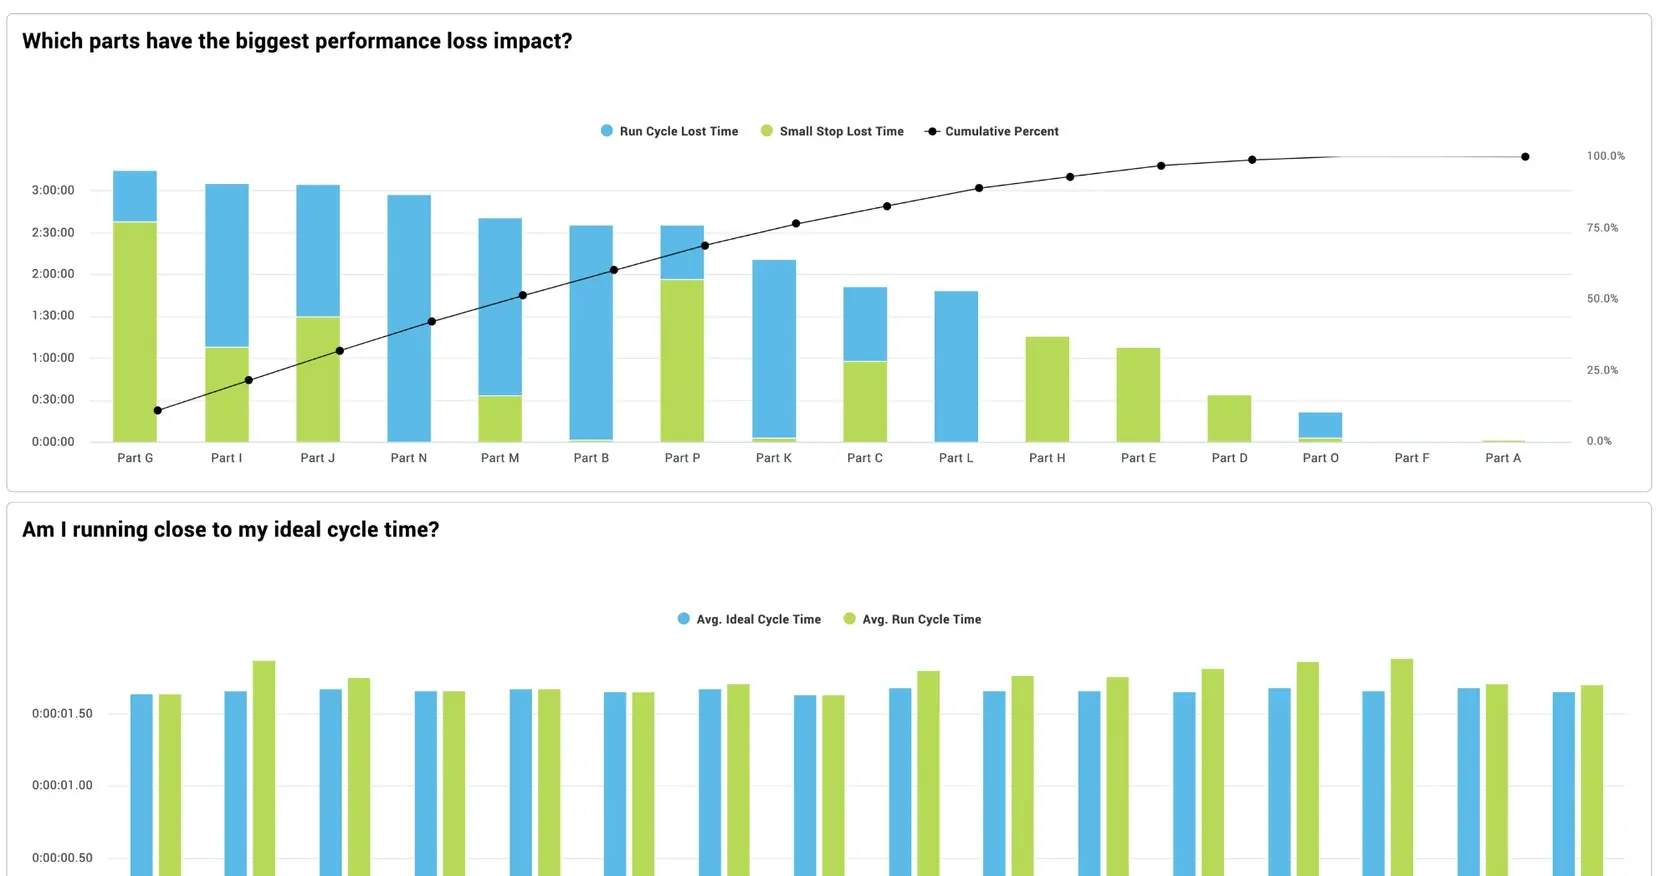
Built-in Performance Loss report depicting Performance Loss by Part and Ideal Cycle Time compared to Run Cycle Time.
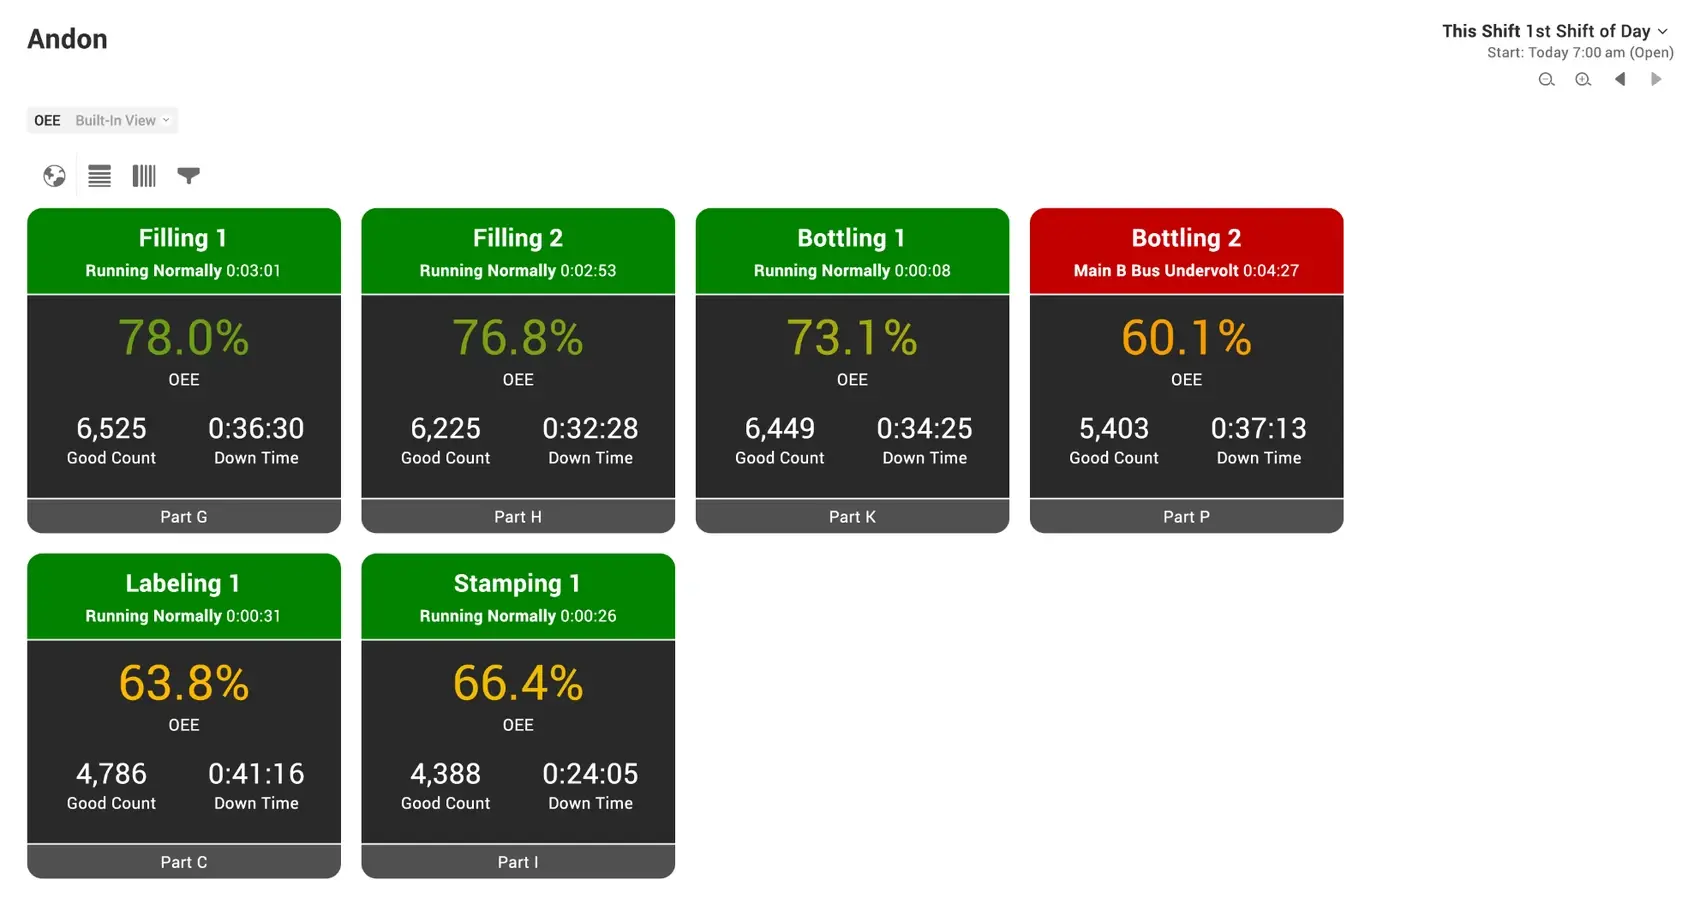
Built-in Andon report showing the real-time status of every line in your Enterprise.
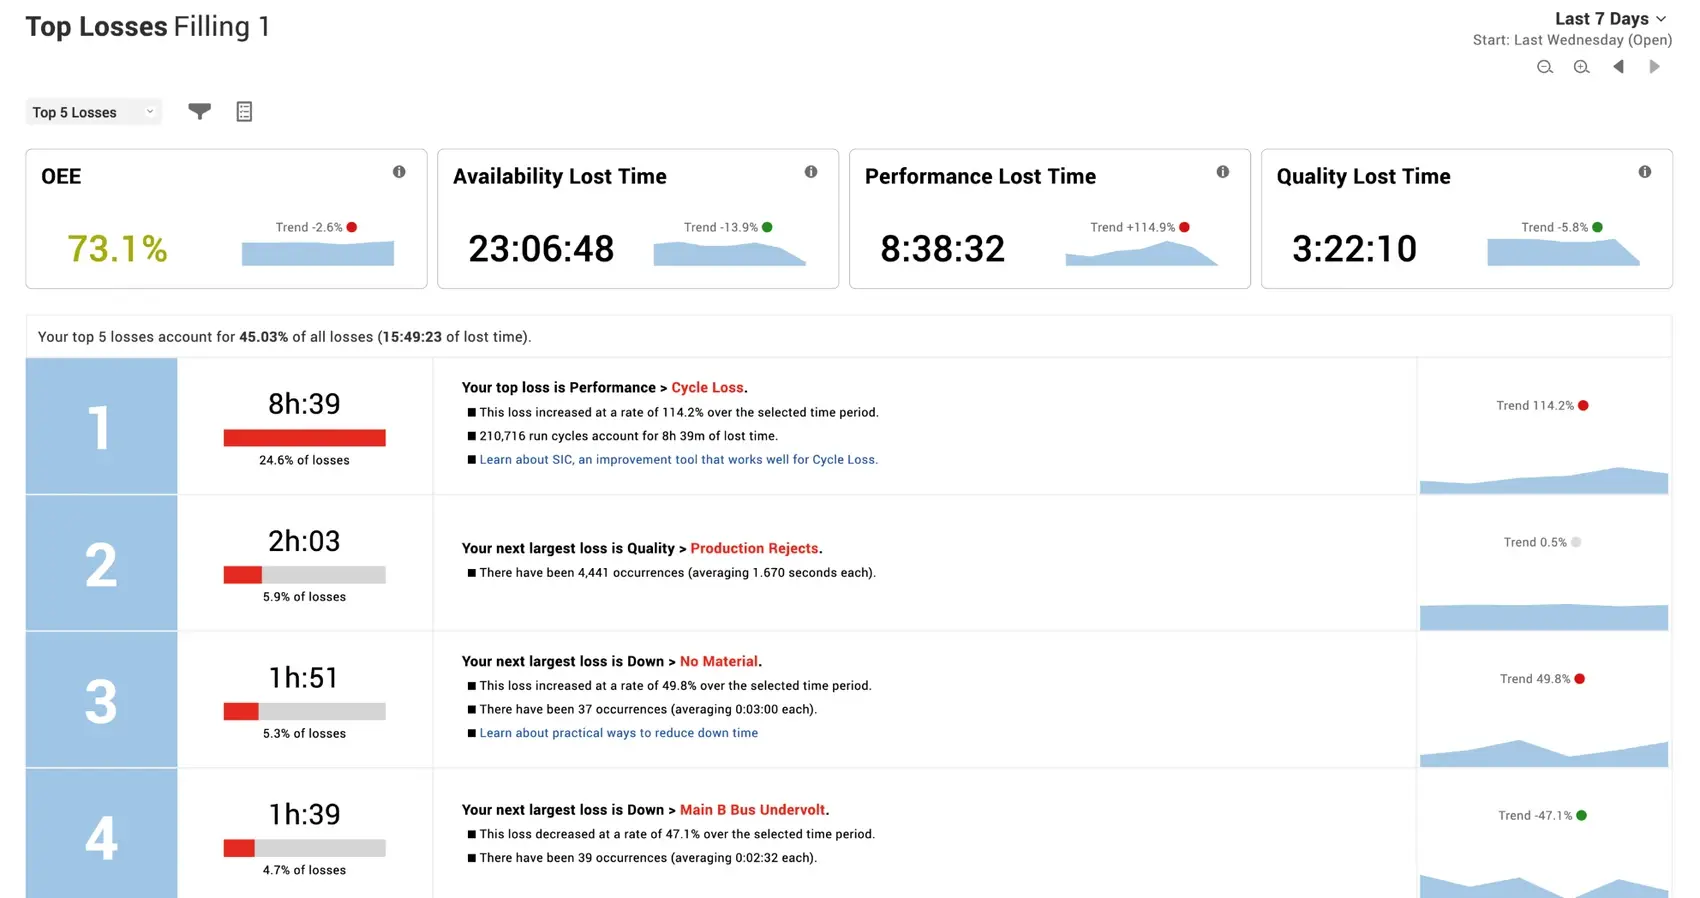
Built-in Top Losses report configured to identify the top five production losses over the past week for a Filling line.
Built-in TEEP report that highlights Utilization and Hidden Factory Time to extend improvement beyond OEE.
Custom “Daily Shift Report” built in just minutes using the Vorne XL Dashboard interface.
Most teams already have data. What they don’t have is clarity on where to go from there.
With XL, teams move from reacting to problems to continuously improving performance - because they can see, understand, and act on what’s actually happening on the line.
Most teams have data, but lack clarity on what to do next.
- See what’s happening in real time - as production runs
- Understand why it’s happening - with reports and analysis
- Focus on the highest-impact losses - not just the loudest issues
- Improve performance over time - with clear, measurable results
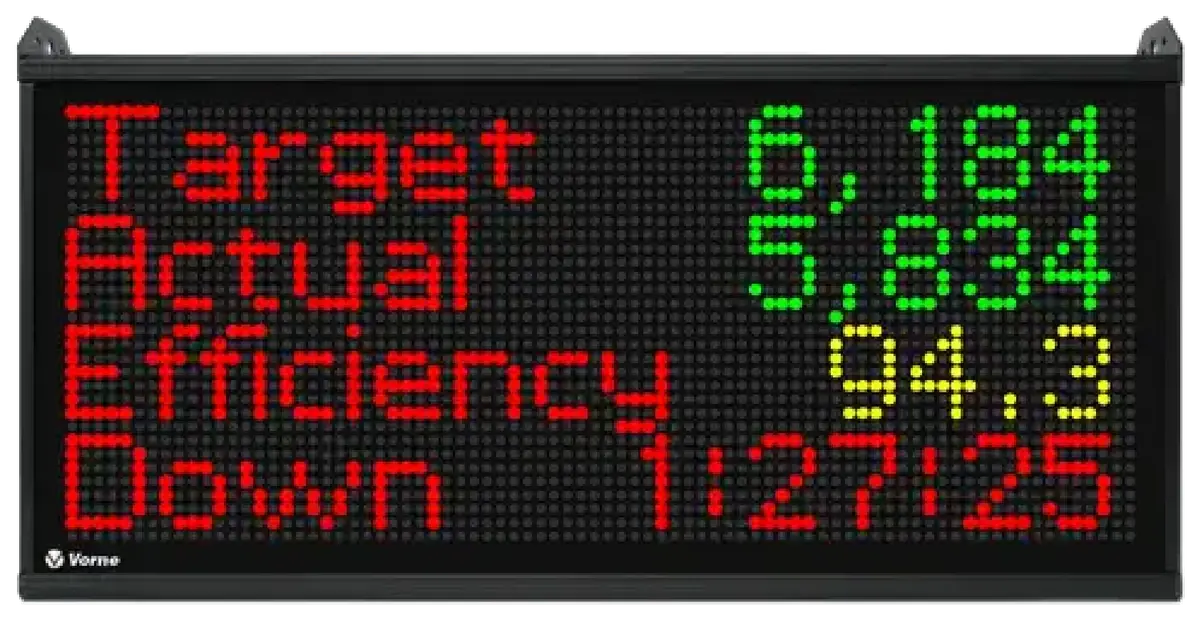
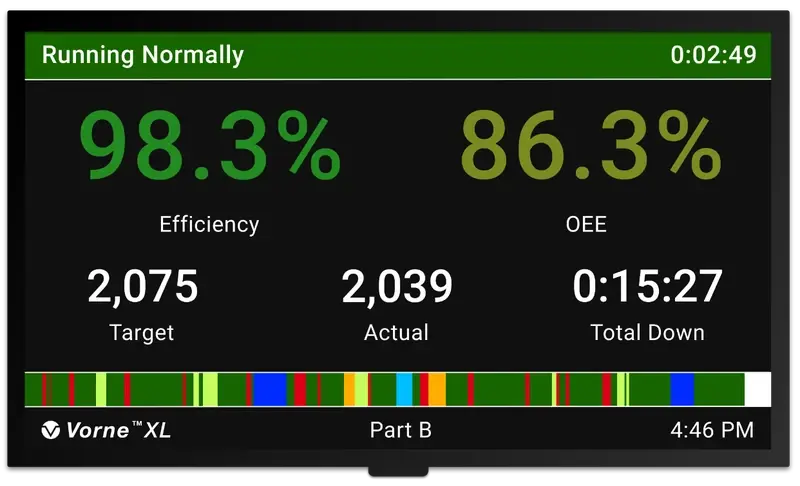
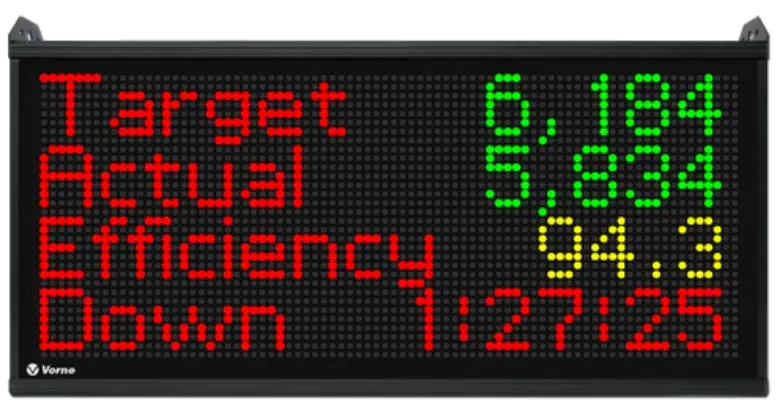
This is an example of an XL plant-floor scoreboard.
It motivates your operators with real-time data so they can benchmark progress and instantly react to issues during the shift.
The scoreboard enables operators to take control and win their shift!
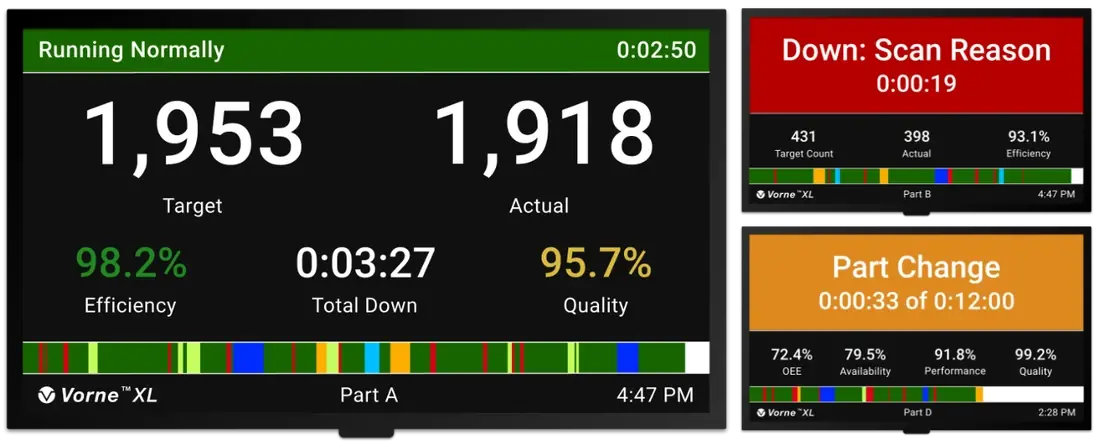
With XL, you’re equipped to make impactful, data-driven decisions. A complete, real-time and historical view of your plant floor from your office and on the shop floor. Track production. Hit your targets. Attack issues immediately.
Receive automated email reports and email or text alerts. Access built-in reports or create your own custom reports and dashboards. Combine essential metrics with interactive tools for easy exploration, like:
- Shift timeline by Production State events,
- Downtime Pareto by Reason,
- Andon production review, and
- OEE deep dive.
Visualize performance instantly, monitor downtime, and identify opportunities for improvement, all in one user-friendly platform.
XL’s adaptable reporting lets you see the data you need, exactly how you need it.










Affordable One-Time Cost
No software to install, no servers to maintain, no recurring fees, no contracts, unlimited users. You fully own and fully control your data!
In-Stock Units and Quick Setup
XL is in stock and ready to ship. It’s also incredibly easy to deploy. Two sensors, and about eight hours of your time. Done!
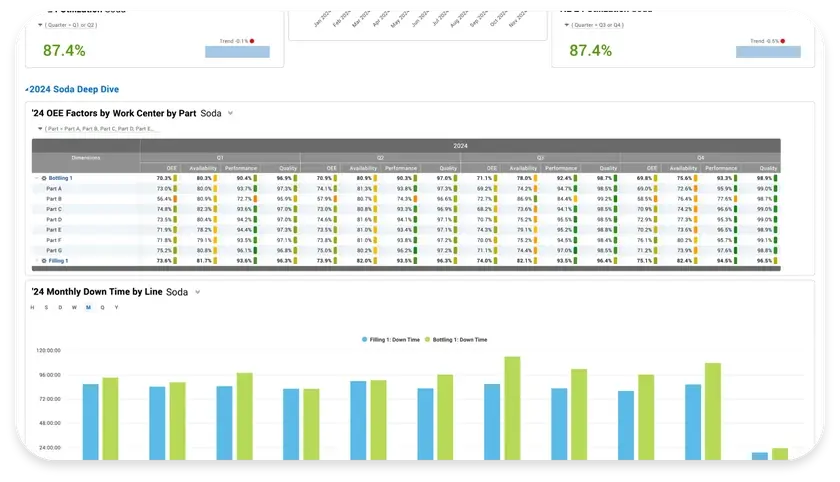
Intuitive Reporting Interface
XL makes it quick and easy to create custom dashboards using a combination of configurable pre-built data visualizations and live controls.


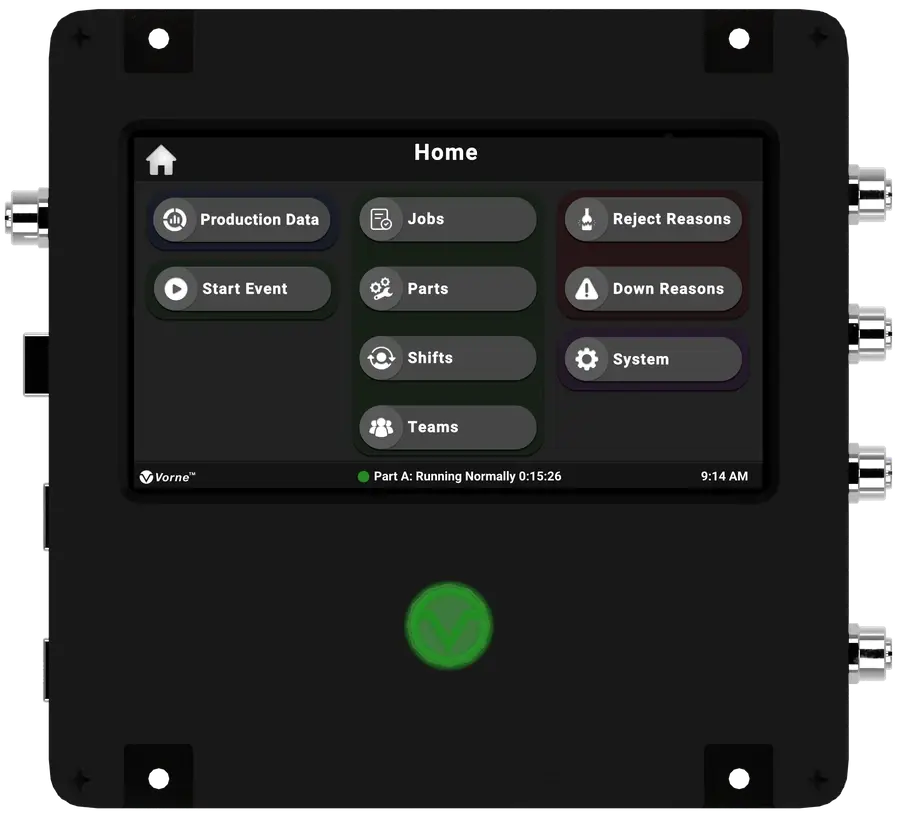
XL Touch
XL HD+
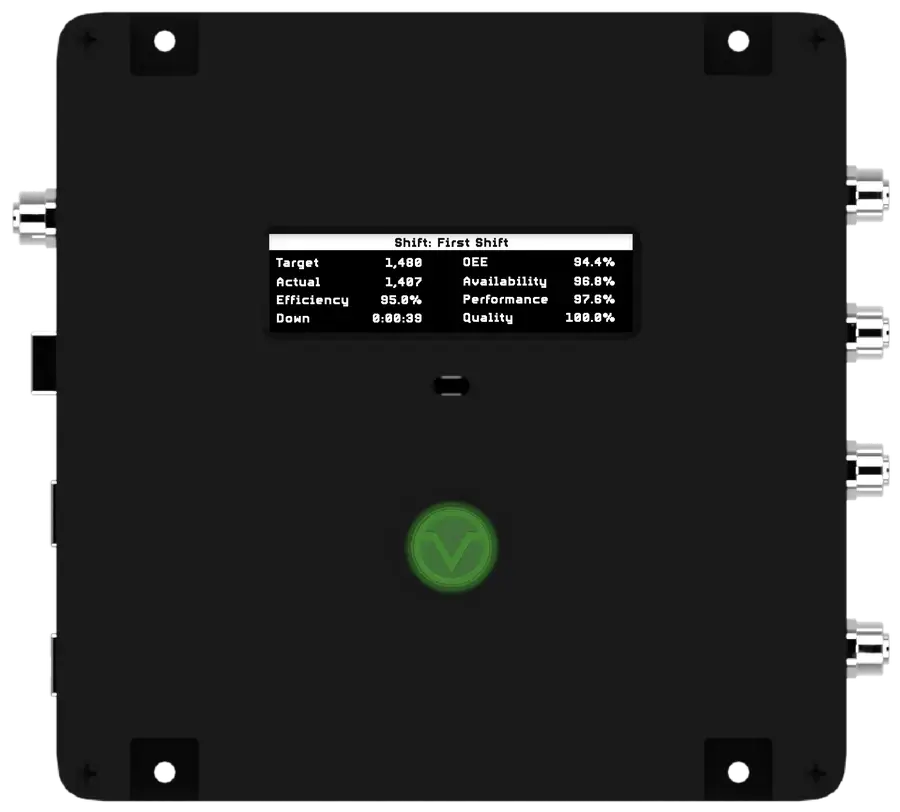
XL810-1
Our most popular model, the XL Touch, includes an integrated touchscreen that enables operators to view shift performance, add downtime reasons, and interact directly with XL in real time.
$4,990
View XL TouchXL HD+ is the lowest-cost XL model while still providing the same data capture, real-time production monitoring, historical reporting, and plant floor visibility across your operations.
$4,690
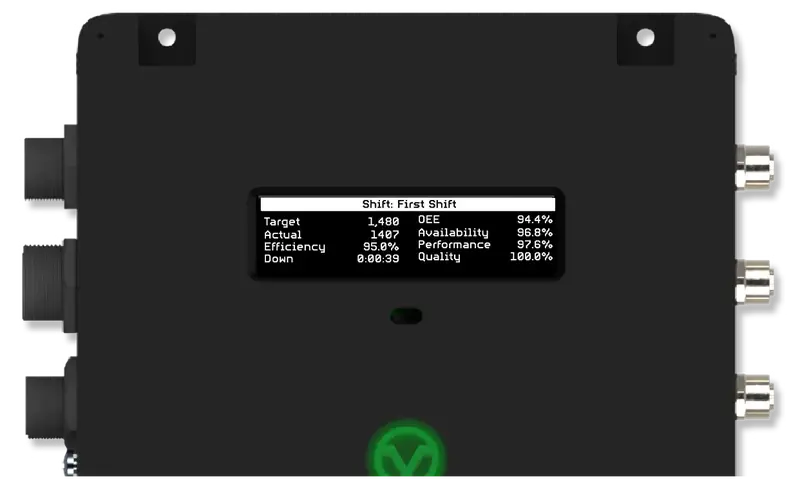
View XL HD+XL810-1 is our legacy fully integrated industrial LED plant floor scoreboard. Display four real-time metrics on the plant floor during the shift like Target, Actual, Efficiency, and Down. Includes the same XL Platform as newer models.